The worth of the SEO industry is more than $50 billion as of 2025. It is expected to grow immensely in the future.
If you are a marketer or SEO specialist and want to know all the essential statistics of SEO, here we compiled all the vital statistics about SEO.
These SEO statistics will help you to build your SEO strategy in 2025.
Without wasting time, let’s see it.
Top SEO Statistics 2025 (Top Picks)
- Artificial Intelligence and machine learning is the top shift in SEO, with 18.7% worldwide as of 2023.
- Google’s search engine market share is 93.18% in 2023.
- 76% of people visit local businesses after searching on mobile for those local businesses.
- “Near me” and “Where to buy” search queries are increased by 200% in recent years.
- When 1.3 YouTube videos were analyzed, it was found that the number of likes, comments, views, and shares is strongly related to YouTube ranking.
- 96% of people watch learner videos of products or brands before buying that.
- 55% of all traffic comes from mobile.
- 20% of the email marketing campaigns are not mobile-optimized.
- Over 40% of all voice search answers are pulled from feature snippets.
- 39.4% of all internet users in the United States use voice assistance at least once every month.
- 57% of marketers think content development is the most effective marketing strategy.
- SaaS companies that use content marketing have 30% higher growth than those that do not use content marketing.
- Over 90.63% of pages do not get organic search traffic on Google.
- Guest posting and content marketing are the most effective link-building methods, with 11.7% and 12.5%, respectively.
- 37.9% of SEO professionals state that budget constraints is the main challenge for search engine optimization.
SEO Statistics (General)
- Artificial Intelligence and machine learning is the top shift in SEO, with 18.7% worldwide as of 2023.
The following table shows leading shifts in SEO worldwide as of 2023.
| Leading Shifts in SEO | Share of Respondents |
| Artificial Intelligence and machine learning | 18.7% |
| Google Updates | 18% |
| Third-Party cookie changes | 13.9% |
| Google zero-click pages | 12.9% |
| Talent competition | 11.5% |
| Site Security | 10% |
| Government Regulations | 9.6% |
| Do not think there are any | 4.7% |
| Other | 0.8% |
Source: Statista.
Search Engine Statistics
Google is the dominating player in the search engine market, with more than 90% of the market share as of 2023.
In this section, we will see all the important statistics about search engines.
- Google’s search engine market share is 93.18% in 2023.
This table shows search engines’ market share in 2023.
| Search Engine | Market Share |
| 93.18% | |
| Bing | 2.87% |
| Yahoo | 1.12% |
| Yandex | 1.02% |
| Baidu | 0.42% |
| DuckDuckGo | 0.52% |
- Google’s search engine market share is 88.73% in the United States in 2023.
The following table shows search engines’ market share in the United States in 2023.
| Search Engine | Market Share |
| 88.73% | |
| Bing | 6.61% |
| Yahoo | 2.36% |
| Yandex | 0.13% |
| DuckDuckGo | 1.94% |
| Ecosia | 0.07% |
- Google was visited 80.2 trillion times in February 2023.
- An average internet user uses Google 3-4 times daily.
- 26.9% of Google’s traffic comes from the United States.
This table shows the top countries that send the most traffic to Google.
| Rank | Top Countries | Share of traffic |
| 1. | The United States | 26.9% |
| 2. | India | 4.5% |
| 3. | Brazil | 4.36% |
| 4. | The United Kingdom | 3.95% |
| 5. | Japan | 3.75% |
- Almost 29.22% of Bing’s traffic comes from the United States.
This table shows the top countries that send the most traffic to Bing.
| Top Countries | Share of Traffic |
| China | 30.52% |
| The United States | 29.22% |
| Janan | 3.92% |
| Germany | 3.69% |
| France | 3.46% |
- 0.11% of Ecosia’s traffic comes from the United States.
This table shows the top countries that send the most traffic to Ecosia.
| Top Countries | Share of Traffic |
| The United States | 0.11% |
| Germany | 1.03% |
| The United Kingdom | 0.31% |
| France | 1.04% |
- 2.52% of DuckDuckGo’s traffic comes from the United States.
This table shows the top countries that send the most traffic to DuckDuckGo.
| Top Countries | Share of Traffic |
| The United States | 2.52% |
| Germany | 1.05% |
| The United Kingdom | 0.87% |
| France | 0.6% |
- The age group of 25 to 34 years makes up 31.35% of all Google audiences.
This table shows the total audience of Google by age group.
| Age Group | Share of Audience |
| 18 to 24 years | 23.66% |
| 25 to 34 years | 31.35% |
| 35 to 44 years | 19.32% |
| 45 to 54 years | 12.49% |
| 55 to 64 years | 8.13% |
| More than 64 years | 5.04% |
- Google receives 94.47% of traffic from direct searches.
The following table shows the total breakdown of Google traffic.
| Source | Share of traffic |
| Direct | 94.47% |
| Social | 2.56% |
| Referral | 2.24% |
| Search Keywords | 0.48% |
| Emails | 0.21% |
| Display Advertising | 0.04% |
- Mobile contributes 57.24% of searches on search engines worldwide in 2023.
The table below shows the searches on search engines worldwide in 2023 by the device.
| Devices | Share of the device in search engine searches |
| Mobile | 57.24% |
| Desktop | 40.73% |
| Tablets | 2.03% |
- Mobile searches share on search engines is 43.15% in the United States in 2023.
This table shows the searches on search engines in the United States as of 2023 by the device.
| Devices | Share of the device in search engine searches |
| Mobile | 43.14% |
| Desktop | 54.26% |
| Tablets | 2.6% |
- Chrome holds 64.8% of the browser market worldwide in 2023.
The following table shows the share market worldwide in 2023 by the browser.
| Browser | Market Share |
| Chrome | 64.8% |
| Safari | 19.5% |
| Edge | 4.63% |
| Firefox | 2.93% |
| Samsung Internet | 2.57% |
| Opera | 2.33% |
| UC Browser | 0.89% |
| Android | 0.69% |
| IE | 0.26% |
- In the United States, Google.com gets 59.30% of all searches.
This table shows the distribution of U.S. searches across ten web properties.
| Web Properties | Share in the U.S. |
| Google.com | 59.30% |
| Google Images | 26.79% |
| YouTube | 3.71% |
| Yahoo | 2.47% |
| Bing | 2.25% |
| Google Maps | 2.09% |
| Amazon | 1.85% |
| 0.69% | |
| DuckDuckGo | 0.56% |
| Google News | 0.28% |
Source: Demandsage, Statista, Statcounter, Moz.
Local SEO Statistics
Nearly 4.5/10 people Google search for local businesses.
For local businesses, it is essential to plan correct SEO strategies for their business.
In this section, we will see all the important statistics about local SEO.
- 46% of Google searches are for local services or local businesses.
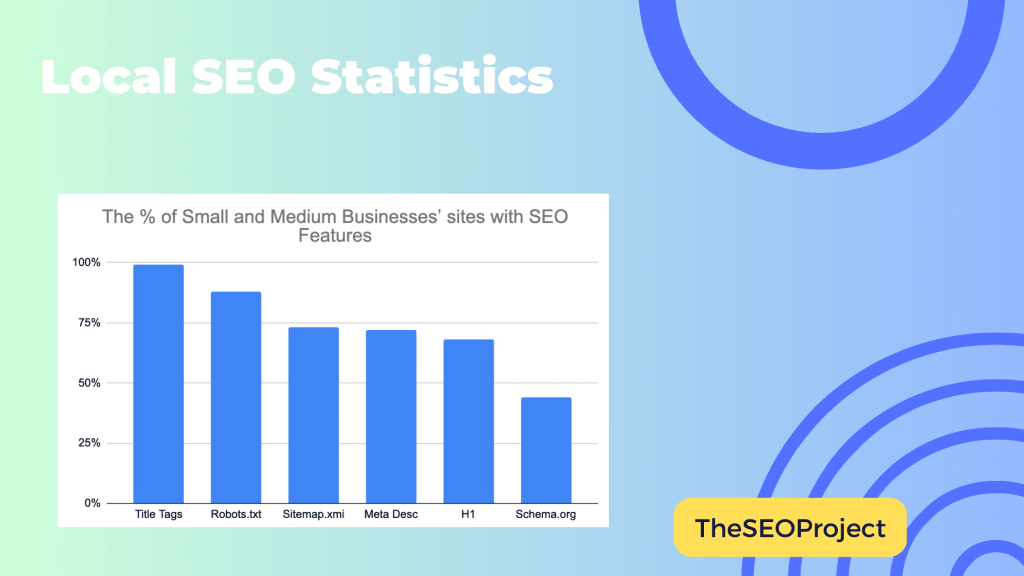
- 25% of websites of small businesses do not have H1 tags.
The following table shows the percentage of small and medium businesses’ sites with SEO features.
| SEO Features | Percentage of SMB sites |
| Title Tags | 99% |
| Robots.txt | 88% |
| Sitemap.xmi | 73% |
| Meta Desc | 72% |
| H1 | 68% |
| Schema.org | 44% |
- 28% of local searches turned into purchases.
- 76% of people visit local businesses after searching on mobile for those local businesses one day before.
- 97 billion searches are for local businesses in a month.
This table shows the searches for local businesses by time period.
| Time Period | Searches for local businesses |
| In a year | 1.17 trillion |
| In a month | 97 billion |
| In a day | 3.2 billion |
| Every second | 37K |
- 30% of searches on mobile are related to location.
- 54% of searches for local businesses search for business hours, and 53% search for the location of businesses.
- “Near me” and “Where to buy” search queries are increased by 200% in recent years.
- “Store open near me” search queries increased by 250%.
Source: Backlinko, Ahref.
Video SEO statistics
97% of people watch detailed videos of a product before purchasing it. People want to watch more videos about products and brands.
In this section, we will see all the important statistics about video SEO.
- The first page YouTube video average length is 14 minutes and 50 seconds.
- 68.2% of YouTube’s first page is HD videos.
- When 1.3 YouTube videos were analyzed, it was found that the number of likes, comments, views, and shares is strongly related to YouTube ranking.
- Videos that bring new subscribers will likely rank higher on YouTube.
- Video and posts can bring more backlinks and see over 157% boost in search traffic.
- 49% of markets say they make revenue faster by using video in their marketing strategy.
- 51% of marketing professionals say videos are the best content for ROI.
- 64% of shoppers watching the brand’s videos on social media make purchases.
- 85% of all internet users in the United States interact with video content monthly.
- 86% of customers want to watch more videos from the brand they support.
- Videos on social media generate 1200% more shares than images and text.
- 96% of people watch learner videos of products or brands before buying that.
- The sweet spot of video ads is 6 to 10 seconds.
- 72% of markets made explainer videos in their marketing strategy.
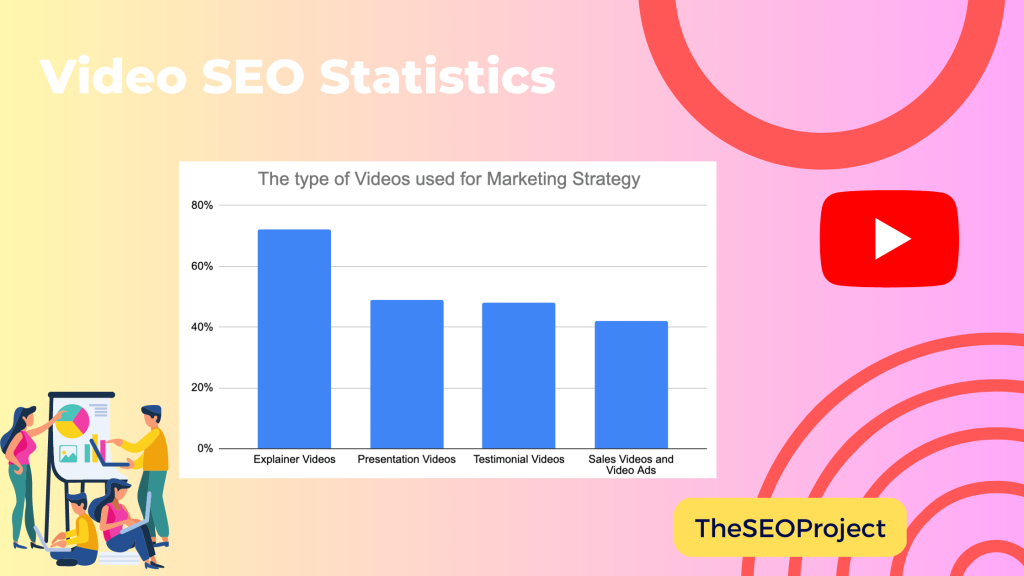
The below table shows the type of videos markets uses for their marketing strategy.
| Video Type | Share of Marketers |
| Explainer Videos | 72% |
| Presentation Videos | 49% |
| Testimonial Videos | 48% |
| Sales Videos and Video Ads | 42% |
- 87% of marketers said videos gave them positive returns on investment in 2021.
This table shows the percentage of marketers who got positive returns on investment due to video marketing strategy from 2015 to 2021.
| Year | Share of Marketers |
| 2015 | 33% |
| 2016 | 76% |
| 2017 | 83% |
| 2018 | 78% |
| 2019 | 83% |
| 2020 | 88% |
| 2021 | 87% |
- The video engagement rate of Facebook is 0.26% which is 0.11% higher than the average engagement rate for video, 0.15%.
- On Twitter, video watch time of entertained videos is +85%.
The following table shows Twitter’s total video watch time by category.
| Category | Video Watch Time |
| Entertainment | 85% |
| Sports | 31% |
| News | 73% |
| Creators | 34% |
- Instagram video ads get 3X times more engagement than image ads.
Source: Ahref, Backlinko, Wordstream.
Mobile SEO statistics
There are 7.33 billion mobile users worldwide as of 2023. They make up almost 94% of total world’s population.
As a result, Mobile SEO has become essential nowadays.
In this section, we will see all the important statistics about mobile SEO.
- 55% of all traffic comes from mobile.
- The top 80% of ranked pages are optimized for mobile.
- 30% of all mobile searches are location-based.
- 20% of the email marketing campaigns are not mobile-optimized.
- Mobile contributes 58% of all Google searches.
- 51% of searchers found new businesses while searching on mobile.
- 87% of mobile users use search engines daily.
- 20% of voice searches come from mobile.
- 90% of smartphone users are unsure about which brand to purchase.
- 33.33% of email clicks are attributed to mobile devices.
Source: Demandsage.
Voice SEO statistics
According to Oberlo, 50% of the population in the United States uses voice assistance daily. People started using voice assistance like never before.
In this section, we will see all the important statistics about voice SEO.
- Over 40% of all voice search answers are pulled from feature snippets.
- HTTPS websites comprise over 70% of voice search result pages.
- Voice search answers contain an average of 29 words.
- 39.4% of all internet users in the United States use voice assistance at least once every month.
- There are 122.7 million people in the United States who use voice assistance.
This table shows the number of voice assistant users from 2017 to 2021.
| Year | Number of people who use voice assistance | Percentage of users of voice assistance (% of the total population) |
| 2017 | 79.90 million | 24.5% |
| 2018 | 102 million | 31.1% |
| 2019 | 111.80 million | 33.8% |
| 2020 | 117.70 million | 35.4% |
| 2021 | 122.70 million | 36.6% |
- 40% of adults use voice assistance daily.
- 1 million voice assistance searches are conducted each month.
- 24% of people aged between 16 to 24 years use mobile searches.
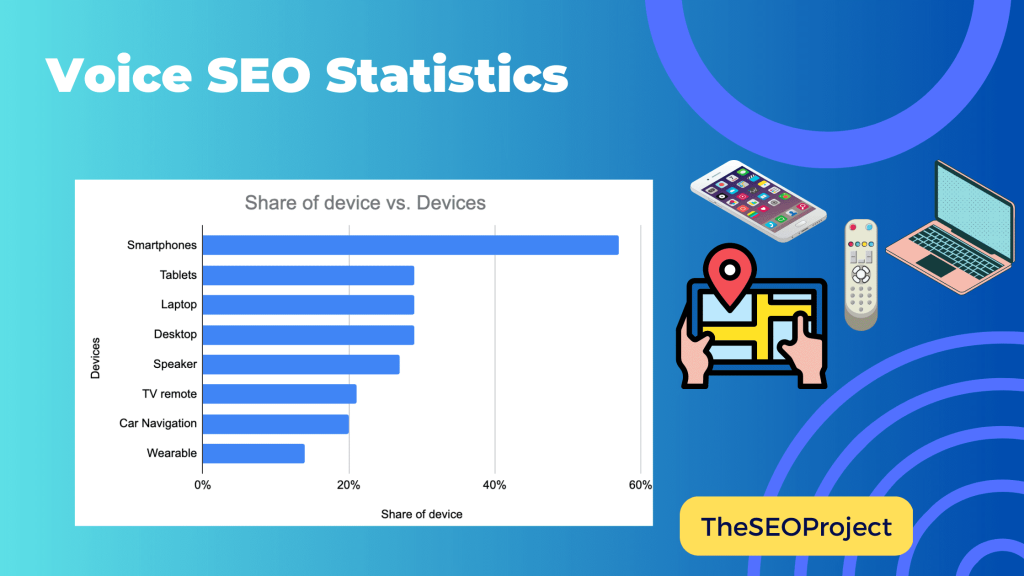
- The smartphone is the most popular device for voice searches, with 57%.
The following table shows the most popular devices for voice searches.
| Devices | Share of device |
| Smartphones | 57% |
| Tablets | 29% |
| Laptop | 29% |
| Desktop | 29% |
| Speaker | 27% |
| TV remote | 21% |
| Car Navigation | 20% |
| Wearable | 14% |
- The age group of 25 to 49 use voice searches more than all, with 65%.
This table shows the use of voice searches by age group.
| Age Group | Use of voice search |
| 18 to 24 years | 59% |
| 25 to 49 years | 65% |
| More than 50 years | 57% |
- 36% of people use Apple Siri’s voice assistance.
The following table shows some popular voice assistances.
| Voice Assistance | Market share |
| Apple Siri | 36% |
| Google Assistant | 36% |
| Amazon Alexa | 25% |
| Microsoft Cortana | 19% |
| Other | 1% |
Source: Demandsage, Blogging Wizard, Semrush.
Content Marketing SEO Statistics
46% of marketers use content strategy to attract traffic. It is the best strategy in marketing to increase sales.
In this section, we will see all the important statistics about Content Marketing statistics.
- 57% of marketers think content development is the most effective marketing strategy.
- 47% of users interact with 3 to 5 pages of content before contacting the business.
- 27% of marketers spend less than $1,000 on content marketing.
This table shows the spending on content marketing.
| Money spends on content marketing | Share of respondents |
| Less than $1,000 | 27% |
| $1,000 to $3,000 | 19% |
| $3,000 to $5,000 | 20% |
| $5,000 to $10,000 | 17% |
| $10,000 to $20,000 | 10% |
| More than $20,000 | 6% |
- 28% of marketers said they would increase their content marketing budget by 11% to 25% in 2023.
The following table shows the share of marketers who said they would change their content marketing budget in 2023.
| Change in budget | Percentage of change | Share of marketers |
| Medium increase | 11% to 25% | 28% |
| Small increase | Up to 10% | 25% |
| Remain unchanged | – | 21% |
| Large increase | More than 25% | 16% |
| I don’t know | – | 6% |
| Decrease | – | 3% |
- 73% of marketers use social media for promoting content marketing.
This table shows the ways of promoting content.
| Ways of promoting content | Share of Respondents |
| Social Media | 73% |
| Email Marketing | 53% |
| Paid Social Media Ads | 51% |
| Organic Search | 33% |
| Sponsorships | 29% |
| PR and Media Outreach | 28% |
| Influencer Marketing | 25% |
| Guest Posting For content promotion | 11% |
- 56% of marketers said they share their content on social media for organic content promotion.
The following table shows the ways of organic content promotion.
| Ways of organic content promotion | Share of respondents |
| Sharing content on social media | 56% |
| Optimizing content for search | 32% |
| Facebook Groups | 26% |
| PR/Media Relation | 25% |
| Link Building | 19% |
| Articles in a third-party publication | 18% |
| LinkedIn groups | 17% |
| 16% | |
| Influencer and expert partnerships | 15% |
| Quora | 12% |
| Forum | 8% |
| None of the above | 4% |
| Other | 1% |
- 53% of marketers said their page engagement went up after updating content.
This table shows the results marketers got after updating content.
| Results marketers get after updating content | Share of respondents |
| The engagement went up | 53% |
| Ranking/Traffic increased | 49% |
| Nothing Changed | 15% |
| Ranking/Traffic decreased | 13% |
| The engagement went down | 12% |
| We did not update content | 4% |
- 46% of marketers said attracting more traffic to their website is their top content marketing goal in 2023.
The table below shows the leading content marketing goals for 2023.
| Leading content marketing goals | Share of Respondents |
| Attract more traffic | 46% |
| Increase brand awareness | 45% |
| Generate leads | 34% |
| Generate sales/revenue | 25% |
| Improve customer loyalty and engagement | 23% |
| Build and nurture a subscriber/followers | 17% |
| Promote new products/improve product positioning | 11% |
| Other | 0% |
Source: Semrush.
SaaS SEO Statistics
SaaS companies are also using content marketing in their marketing strategy. They received traffic by using content marketing.
In this section, we will see all the important statistics of SaaS SEO.
- SaaS companies that use content marketing have 30% higher growth than those that do not use content marketing.
- 15% of top SaaS brands do not have blogs worldwide.
- 53.6% of traffic is received from direct traffic by SaaS companies.
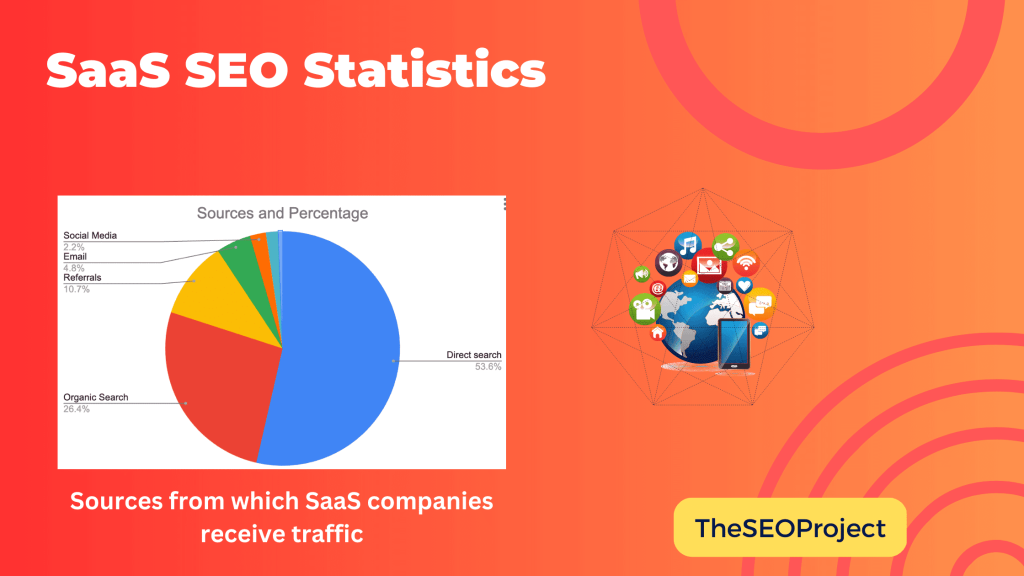
This table shows the source from which SaaS companies receive traffic.
| Source | Percentage |
| Direct search | 53.6% |
| Organic Search | 26.4% |
| Referrals | 10.7% |
| 4.8% | |
| Social Media | 2.2% |
| Paid Search | 1.7% |
| Display Ads | 0.6% |
- Of all SaaS companies’ social media traffic, YouTube contributes the more, with 33%.
The following table shows the total breakdown of Social media traffic of SaaS companies.
| Social Media Platforms | Share of Traffic |
| YouTube | 33% |
| 28% | |
| 19% | |
| 9% | |
| WhatsApp Web app | 9% |
| 7% | |
| Stack Overflow | 9% |
| 6% | |
| 4% | |
| Vkontakte | 3% |
| Quora | 10% |
Source: techtipswithtea.com.
Ranking Statistics
7% of pages rank between the 1 to 10 search results within the year of their publication. There are many factors which are affecting on ranking.
In this article, we will see all the important statistics about ranking.
- Over 90.63% of pages do not get organic search traffic on Google.
The table below shows the visits of pages on Google.
| Page Visit | Percentage of Pages |
| 0 visits | 90.63% |
| 1 to 10 visits | 5.29% |
| 11 to 100 visits | 2.84% |
| 101 to 1000 visits | 1.04% |
| More than 1001 visits | 0.21% |
- The top-ranking pages get organic traffic 49% of the time.
- 7% of pages rank in the top 10 search results within a year of their publication.
- Almost 7.4% of top-ranking pages do not have title tags.
- 92.6% of top-ranking pages have title tags.
- Google is 33% likelier to rewrite title tags.
- Over 25.% of top-ranking pages do not have meta descriptions.
- 37.22% of the time, Google show meta description in search result.
- Approx 60% of top-ranking pages are over three years old on Google.
This table shows the age of top-ranking pages on Google.
| Age of top-ranking page | Percentage of top-ranking pages |
| One-year-old | 22% |
| Two years old | 18% |
| Three or more than three years old | 58% |
- With 32.8%, the On-page element is the top search engine optimization factor for search ranking.
The following table shows the leading SEO factors for search rankings.
| Search ranking factors | Percentage |
| On-page elements | 32.8% |
| Organic user behavior | 30.9% |
| Depth and accuracy of the content | 24.6% |
| Structured Data | 21.1% |
| Content Freshness | 19% |
| Mobile Friendly | 17.9% |
| Brand Awareness | 17.8% |
| Topic Relevance | 17.5% |
| Links | 17.4% |
| Site Speed | 13.8% |
| Internal Linking | 13.7% |
| Domain Authority | 12.4% |
| Site Security | 11.9% |
| Expertise, Authority, and Trust | 9.4% |
| Social Signals | 7.1% |
Source: Ahref, Backlinko, Statista.
Backlinks Statistics
7.1% of businesses spend more than $15,000 per month on link-building. The link-building method is essential for ranking.
In this article, we will see all the important statistics about link-building.
- Guest posting and content marketing are the most effective link-building methods, with 11.7% and 12.5%, respectively.
The table below shows the top link-building methods.
| Link building methods | Percentage |
| HARO/Expert roundups | 6.1% |
| Content Marketing | 12.5% |
| Guest Posting | 11.7% |
| Link Exchange | 10.9% |
| Link Insertions | 9.9% |
| Forum Links | 9.7% |
| OtherLinksoken Link, redirects, press releases, directories) | 33.7% |
- 38.4% of businesses spend around $1,000 to $5,000 on link buildings monthly.
This table shows the spending on link-building monthly.
| Spending on Link-building | Share of businesses |
| $0 to $1,000 | 34.1% |
| $1,000 to $5,000 | 38.4% |
| $5,000 to 10,000 | 20.3% |
| More than $15,000 | 7.1% |
- Over 58% of businesses think that link-building has a high impact on their search engine ranking.
The following table shows the impact of link building on SERP according to businesses.
| Impact of link-building | Share of respondents |
| Low Impact | 4.1% |
| Moderate Impact | 37.3% |
| High Impact | 58.1% |
| Other | 0.5% |
- Over 56% of businesses think the quantity and quality of links impact ranking.
The table below shows the impact of quantity and quality of links on ranking.
| Impact | Share of respondents |
| Quality | 35.9% |
| Quantity | 7.8% |
| Both | 56.3% |
- 25% of businesses use Google Search Console for link building.
This table shows the share of the link-building tools in link-building.
| Link-building Tool | Share of Tool |
| Google Search Console | 25% |
| Semrush | 21% |
| Ahref | 15% |
| Screaming Frog | 10% |
| Buzzstream | 10% |
| Majestic | 5% |
| Mailshake | 5% |
| Pitchbox | 5% |
| Moz | 4% |
- 22.5% of businesses said their leading key performance indicator is to increase traffic when it comes to the success of link-building.
The following table shows the leading key performance indicators of link-building.
| Main KPI | Share of respondents |
| Traffic increases | 22.5% |
| Ranking increase | 19% |
| Sales/Conversions | 13% |
| Referral traffic | 13% |
| New unique domains | 12% |
| Total links | 10.5% |
| DR increase | 10% |
- Over 66% of pages on Google do not have backlinks.
- More than 43% of top-ranking pages have reciprocal links.
- $361.44 is the average cost of buying links.
Source: Adamconnell, Ahref.
Keywords Statistics
Only 0.0008% of keywords get more than 100,000 searches per month. The keyword is the primary foundation of a good SEO.
In this section, we will see all the important statistics about Keywords.
- 3.81 billion keywords have a 0 to 10 search volume distribution per month.
This table shows the monthly search volume distribution of 4 billion keywords.
| Search Volume | Number of Keywords | Percentage of Keywords |
| 0 to 10 | 3.81 billion | 94.74% |
| 11 to 1000 | 0.20 billion | 5.14% |
| 1001 to 100000 | 0.040 billion | 0.10% |
| More than 1000001 | 31339 | 0.0008% |
- 85 of the search queries are in the form of questions.
- 15% of Google searches are unique; they are never searched before.
- 50% of searches on Google contain four or more words.
Source: Ahref.
Statistics On SEO challenges
32.9% of SEO professionals said that lack of resources is one of the biggest challenges in SEO. There are many challenges in SEO. Want to know more about it, then keep reading.
In this section, we will see all the important statistics about SEO challenges and issues.
- 37.9% of search engine optimization professionals believe that budget constraint is the main challenge for search engine optimization.
The table below shows a list of some more challenges that search engine optimization professionals face.
| Challenges Faced by Search Engine Optimization Professionals | Share of Respondents |
| Budget cuts | 37.6% |
| Strategy Issue | 34.8% |
| Lack of resources | 32.9% |
| Pandemic-related issues | 27.9% |
| Management/stakeholders | 27.3% |
| Alignment with other departments | 27% |
| Scaling processes | 25.8% |
| Client Relationship | 14.1% |
| Legal Approval | 10.6% |
| Not experienced | 5.2% |
| Others | 1.76% |
- 50% of websites think duplicate content is the most common website SEO issue worldwide.
This table shows the most common website SEO issues worldwide.
| The most common website SEO issue | Share of websites |
| Duplicate Content | 50% |
| Missing alt attributes | 45% |
| Duplicate title tags | 35% |
| Broken internal links | 35% |
| Duplicate meta descriptions | 30% |
| Low text-to-HTML ratio | 28% |
| Missing meta descriptions | 25% |
| Broken external links | 25% |
| Multiple H1 tags | 20% |
| Missing H1 | 20% |
| Low word count | 18% |
| Duplicate content in H1 and title | 15% |
| Too much text within the title tag | 15% |
| Too many on-page links | 15% |
| Correct language declaration is missing | 12% |
| Temporary redirects | 10% |
| Broken internal images | 10% |
| Missing title tags | 8% |
| Not enough text within title tags | 4% |
Source: Statista.
Threats to SEO
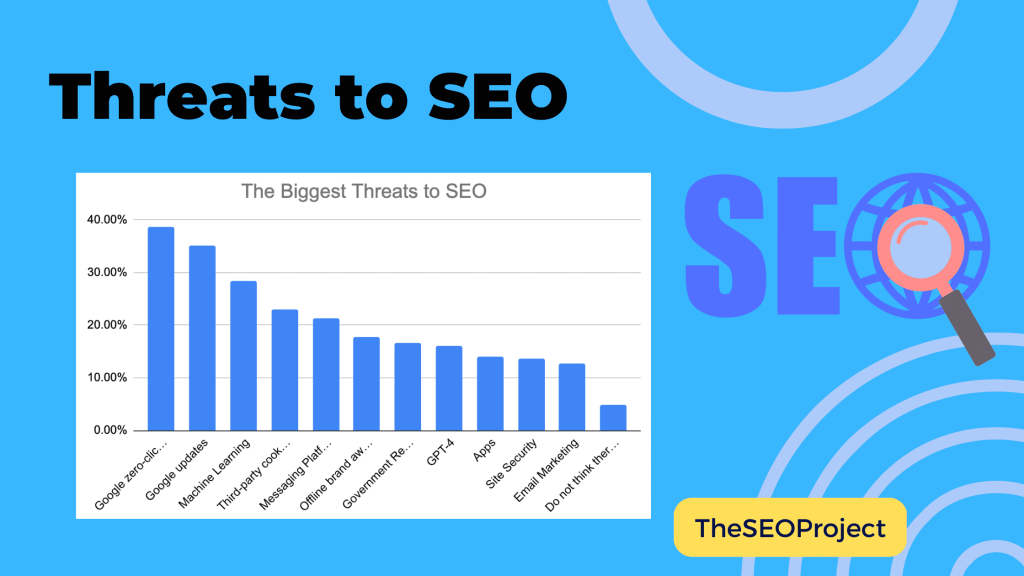
Over 35% of SEO experts say Google Update is one of the biggest threats to SEO.
In this section, we will discuss the threats to SEO.
- 38.7% of SEO experts said Google zero-click pages are one of the biggest threats to SEO.
This table shows the biggest threats to SEO.
| Threats to SEO | Share of SEO experts |
| Google zero-click pages | 38.7% |
| Google updates | 35.1% |
| Machine Learning | 28.4% |
| Third-party cookies change | 22.9% |
| Messaging Platforms | 21.3% |
| Offline brand awareness | 17.8% |
| Government Regulations | 16.7% |
| GPT-4 | 16.1% |
| Apps | 14.1% |
| Site Security | 13.7% |
| Email Marketing | 12.7% |
| Do not think there are any | 4.9% |
Source: Statista.
SEO Trends
There are many trends in SEO. But, in this section, we will see all the essential trends of SEO.
- 18% of searchers search for new queries before clicking on their organic search results.
- 25% of businesses spend on mobile optimization.
- 50% of searches were 1 to 2 words in 2022, and 75% of Google advertisements were 3 to 5. This will make its way into 2023 as well.
- Google’s core update increased website traffic with Artificial Intelligence-generated content in 2022. This will continue in 2023.
- 1.1 billion smartphone users will use voice searches weekly in the future.
- Click-through rate increases by 2 to 3 times through brand connection.
- 2.5 million searches showed that the “People Also Ask” feature now shows almost 49% of searches.
Source: Demandsage.
Future Of SEO
The SEO industry is expected to grow continuously. In this section, we will see some of the important statistics related to the future of SEO.
- The SEO industry expert projects that the SEO industry will reach $99.4 billion by the end of 2027.
- 80% of marketers are using Artificial Intelligence and machine learning. These numbers will increase in the future.
Source: Demandsage.
Here we are at the end of the article. I want to sum up this by saying these SEO statistics are important to your marketing strategy in 2025.
The SEO industry will grow rapidly in the future. To compete with your competitors , you need to plan your SEO strategy correctly.
These SEO statistics are changing every day. For more updates, keep revisiting this article. We assure you that we will be updating this article from time to time.
FAQs
According to Demandsage, the worth of the SEO industry is more than $50 billion as of 2023.
According to Rock content, the average SEO campaign can generate 1000% more traffic
Providing the wrong content to your customer is bad SEO. Not knowing what your customers are searching for does not match search intent.


